Portfolio Project 3
Billion Dollar Disasters
Overview
For your third portfolio project, you’ll apply what you’ve learned about iteration and programming. We’ll work with data from the NOAA on Billion Dollar Disasters in the U.S.
Your task is to create an improved version of the graph below:
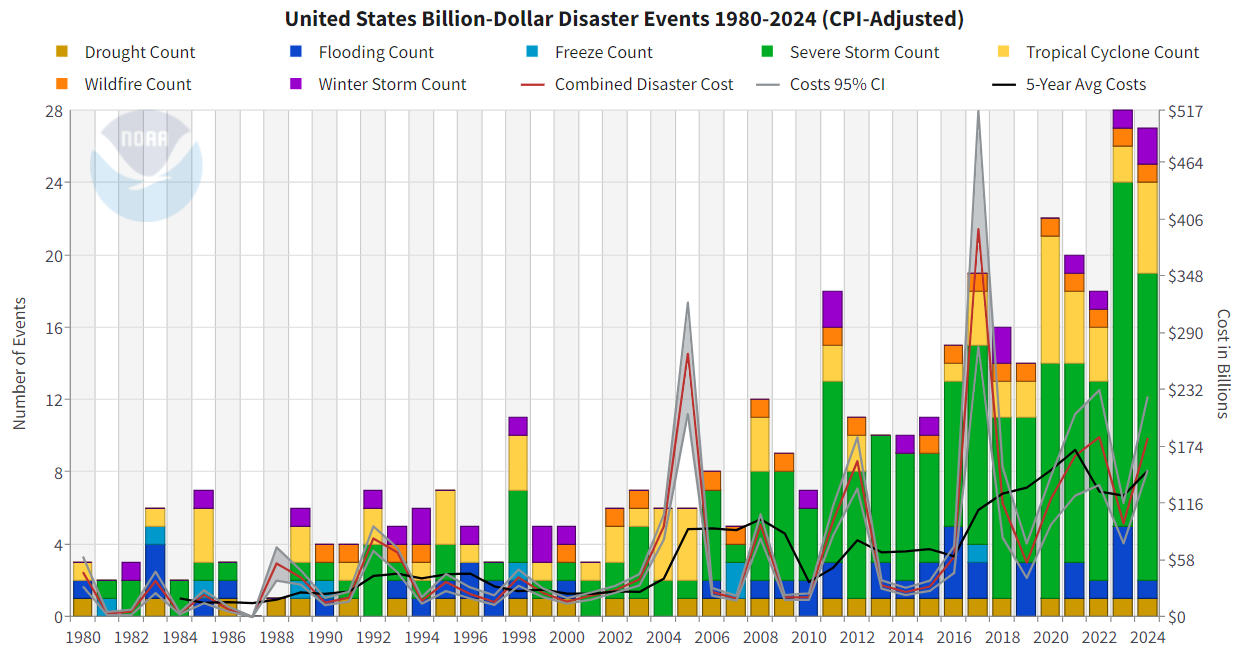
At minimum, you should create two separate plots:
- A bar graph of disaster type in each year
- A time series line plot of the combined (adjusted) cost for each year
To do so, you will need to programmatically read in a different CSV file for each year of the data, and combine them into a single dataset. This should include:
- Writing a function called
read_disaster_datathat takes a file path and correctly reads and wrangles the corresponding data. You should pay attention to variable types (factors should be treated as factors, dates should be treated as dates, etc.)- The “Name” column should include only the name of the storm
- You should add a new column called “Duration” that includes the duration of the disaster
- You should add a new column for “Year” that is based on the original file that the data appeared in
- Using iteration (either map or a for-loop) to apply your function to each data set in the “data” folder
- Using
write_csvto save your final dataset in your repo. (You likely do not want to save it in thedata/folder)
If you get stuck, R for Data Science has a helpful section on Reading Multiple Files that you may refer to. (But remember to reference it in your final report!)
You should write your code in R Markdown, create any graphics using ggplot2, and use tools from this class for data reading, wrangling, and iteration. To submit your work, push your repo to GitHub and submit to gradescope.
Data
The data for this portfolio problem is from the National Centers for Environmental Information at the National Oceanic and Atmospheric Administration.
Your repos will contain the following files:
- data/1980.csv
- data/1981.csv
- …
- data/2024.csv
Where each dataset has the following variables:
| variable | class |
|---|---|
| Name | character |
| Disaster | factor |
| Begin Date | date |
| End Date | date |
| CPI-Adjusted Cost | numeric |
| Unadjusted Cost | numeric |
| Deaths | numeric |
There are also two header rows that contain information about the dataset, but do not need to be read in to R.
Submission
Your submission will be an .Rmd file that creates your two graphs. You should include a paragraph at the beginning that outlines what your code does.
Rubric
A successful project will:
An excellent project will meet all of the requirements for a successful project, plus
Can I work with someone?
This is an individual portfolio project. You may brainstorm with other people in the class, get feedback on any graphs or output, and get conceptual help with debugging or errors, but you should not be sharing code. All work that you submit should be your own. If you do use any resources, they should be properly cited in your report. (I don’t care what citation style you use, as long as it is consistent and contains (a) the title and author of the resource, (b) a link to the resource, and (c) a brief description of what you used it for)
From the syllabus: You are expected to collaborate with your group, but cannot rely on external sources other than to help motivate the questions or provide other background information (including online forums like StackExchange or Reddit). You may use any resources from class and package documentation, but getting answers on significant parts of solutions from outside resources is not allowed.
A note/reminder on AI: Large-language models (e.g. ChatGPT, Gemini, etc.) should only be used for coding or debugging help after you’ve attempted to solve the problem on your own. You should never copy and paste any course materials into a large-language model, and you should never copy and paste anything out of a large-language model into your course materials. Copying, paraphrasing, summarizing, or submitting work generated by anyone but yourself without proper attribution is considered academic dishonesty (this includes output from LLMs). You are not allowed to upload datasets or assignment prompts into a large language model.
There are lots of ways to do this task! I am looking for evidence that you can correctly implement the tools that we’ve discussed in class. If I notice code that looks very different than what we’ve used in course materials, I won’t be able to assess whether you’ve learned the tools from the class and will request a revision. I will refer extreme cases to the ASC.
FAQ
If you have any questions, please post them to the #portfolio-projects channel on slack.