15:00
Github +
Reproducible
Reporting
Day 02
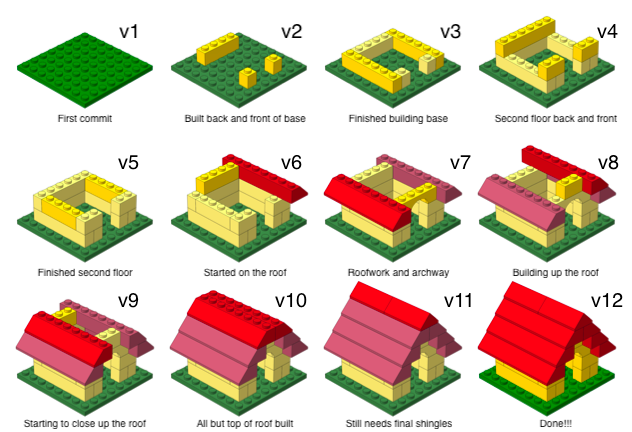
Versioning

Versioning (with human-readable messages)
How does it work for Stat220?
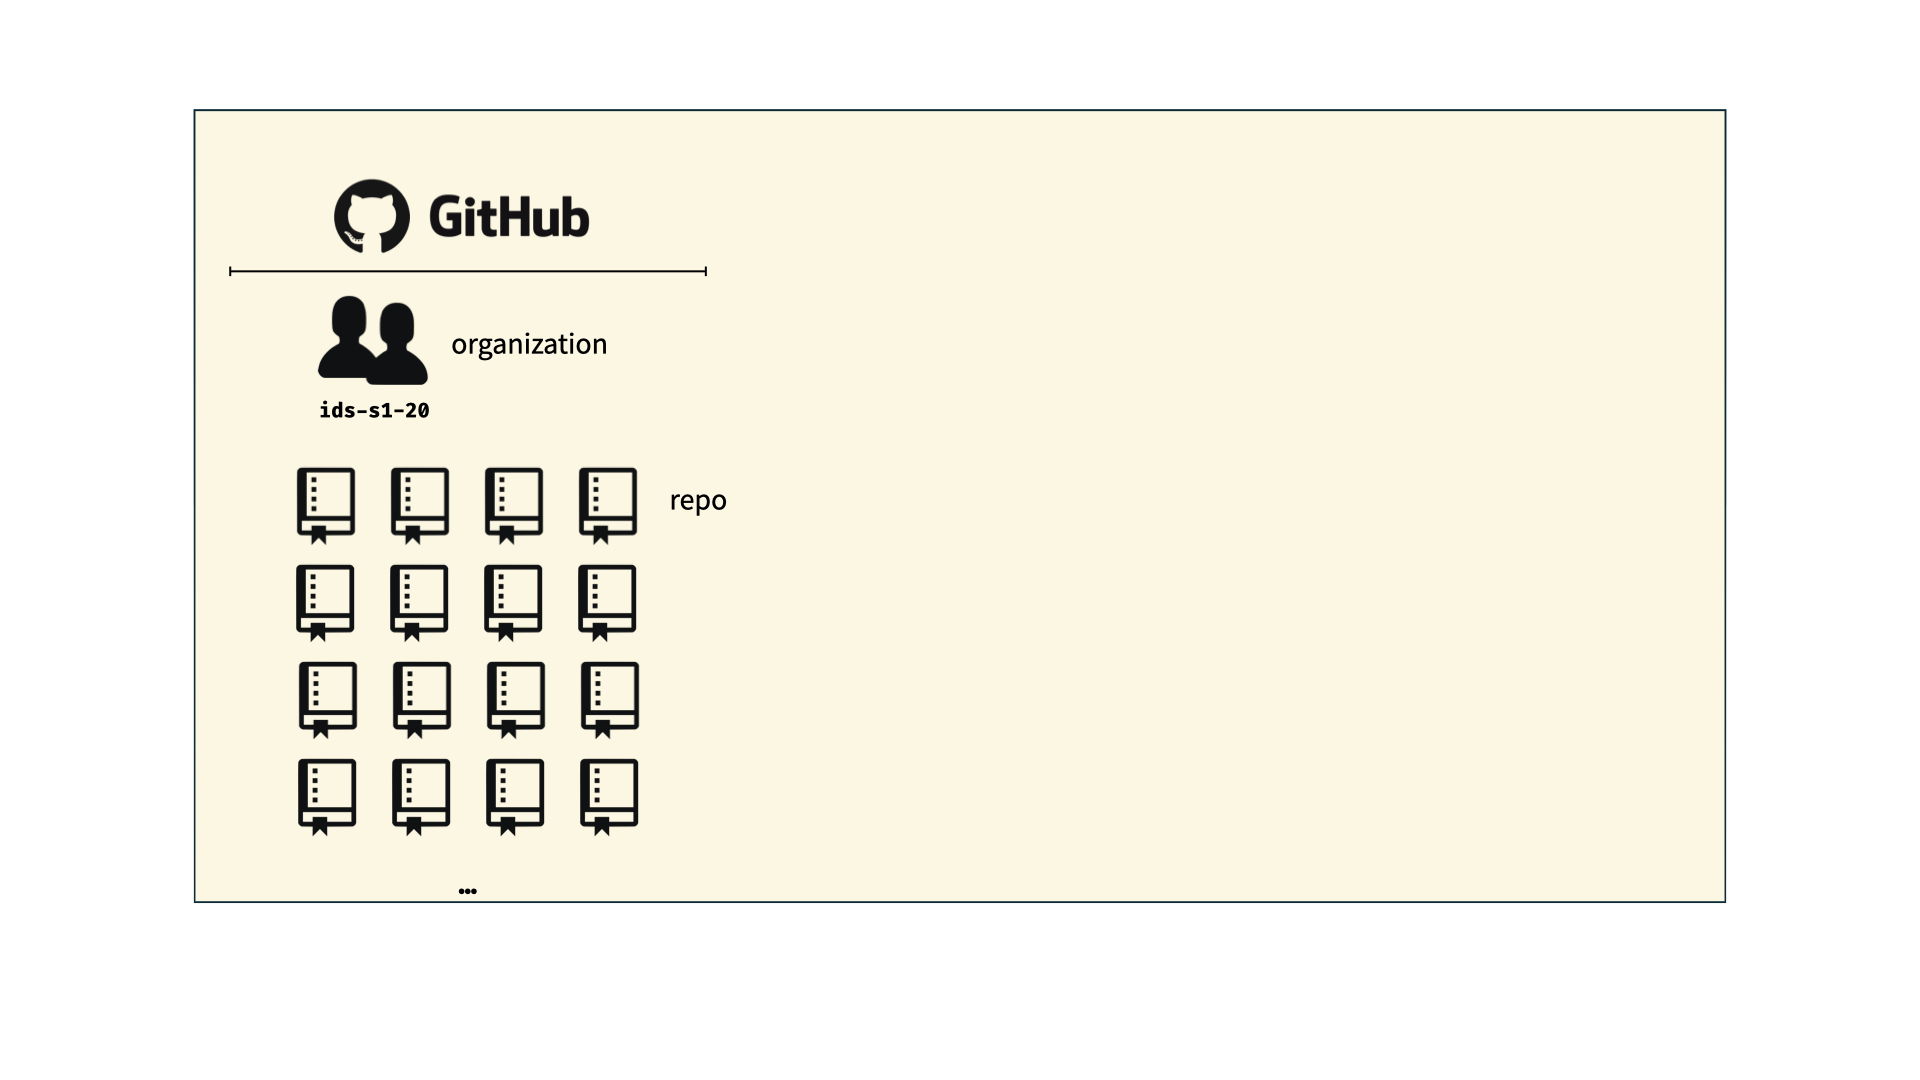
How does it work for Stat220?
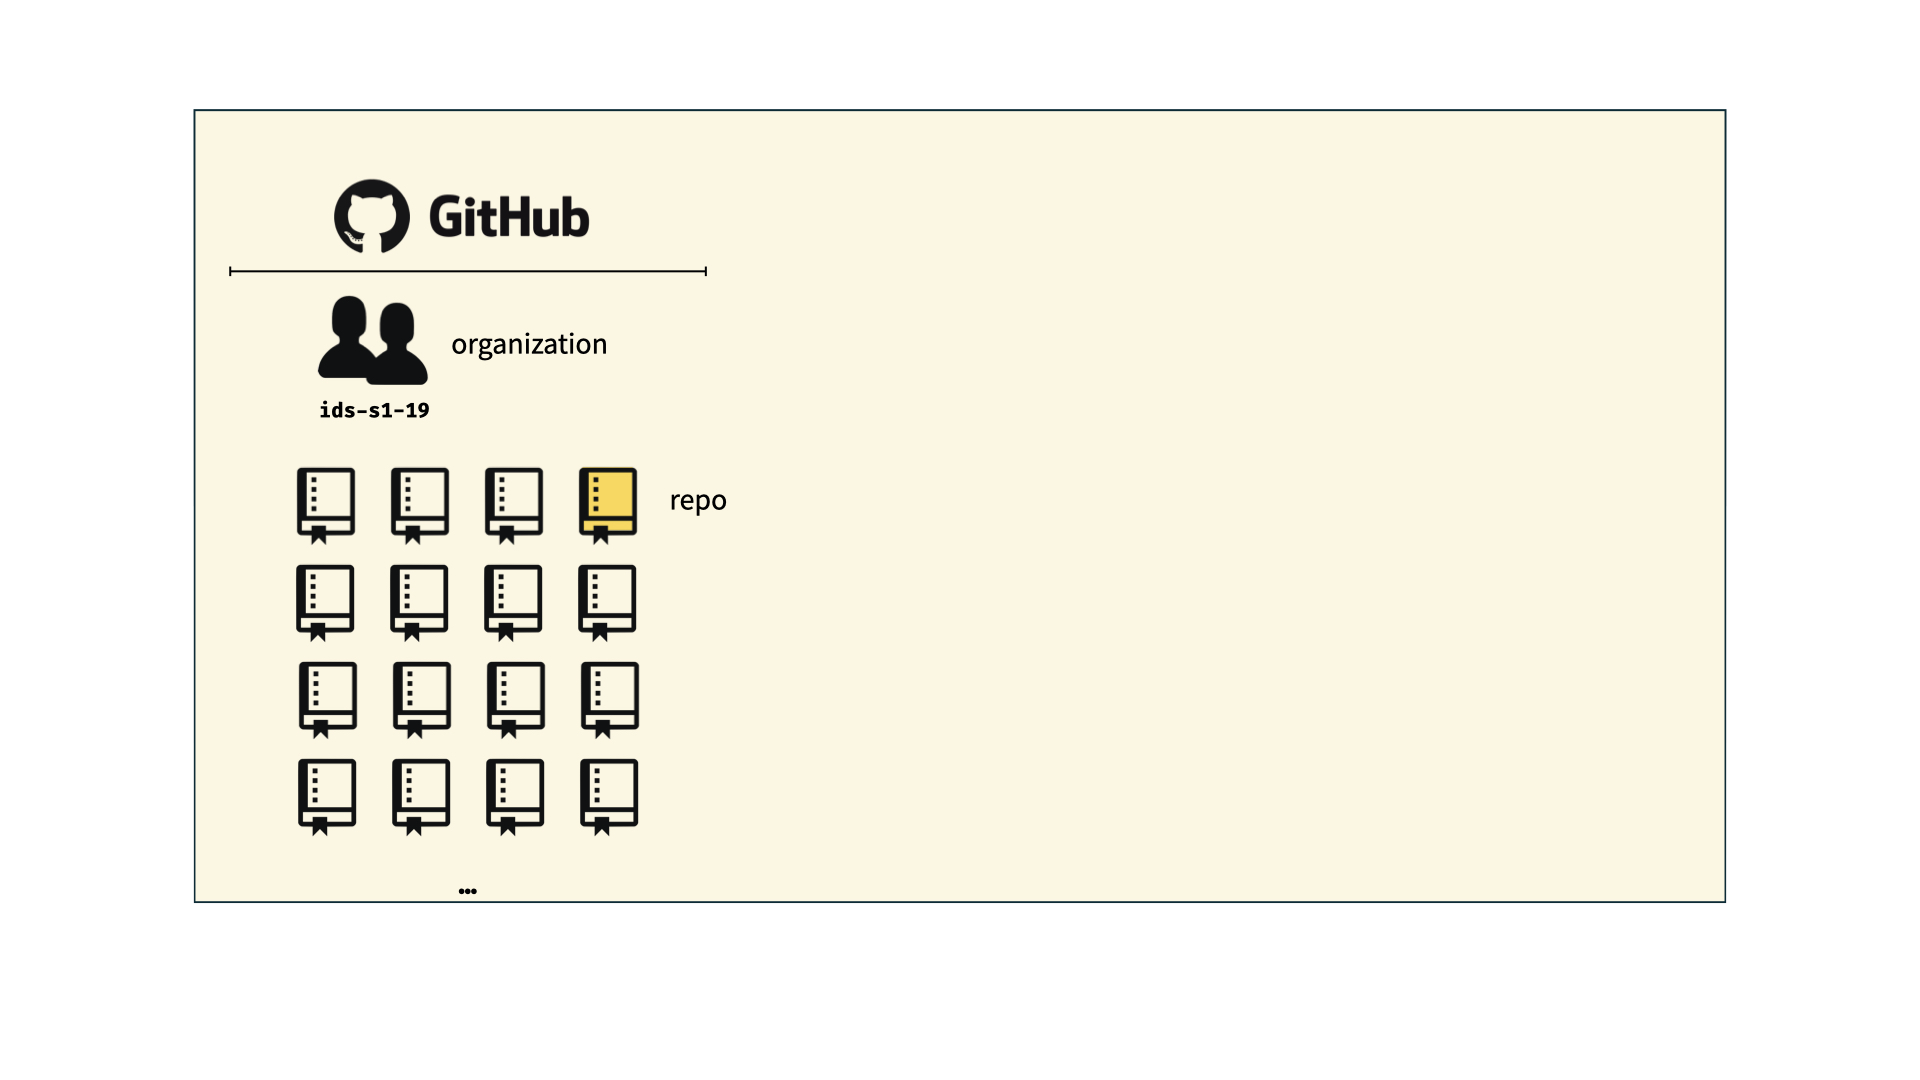
How does it work for Stat220?
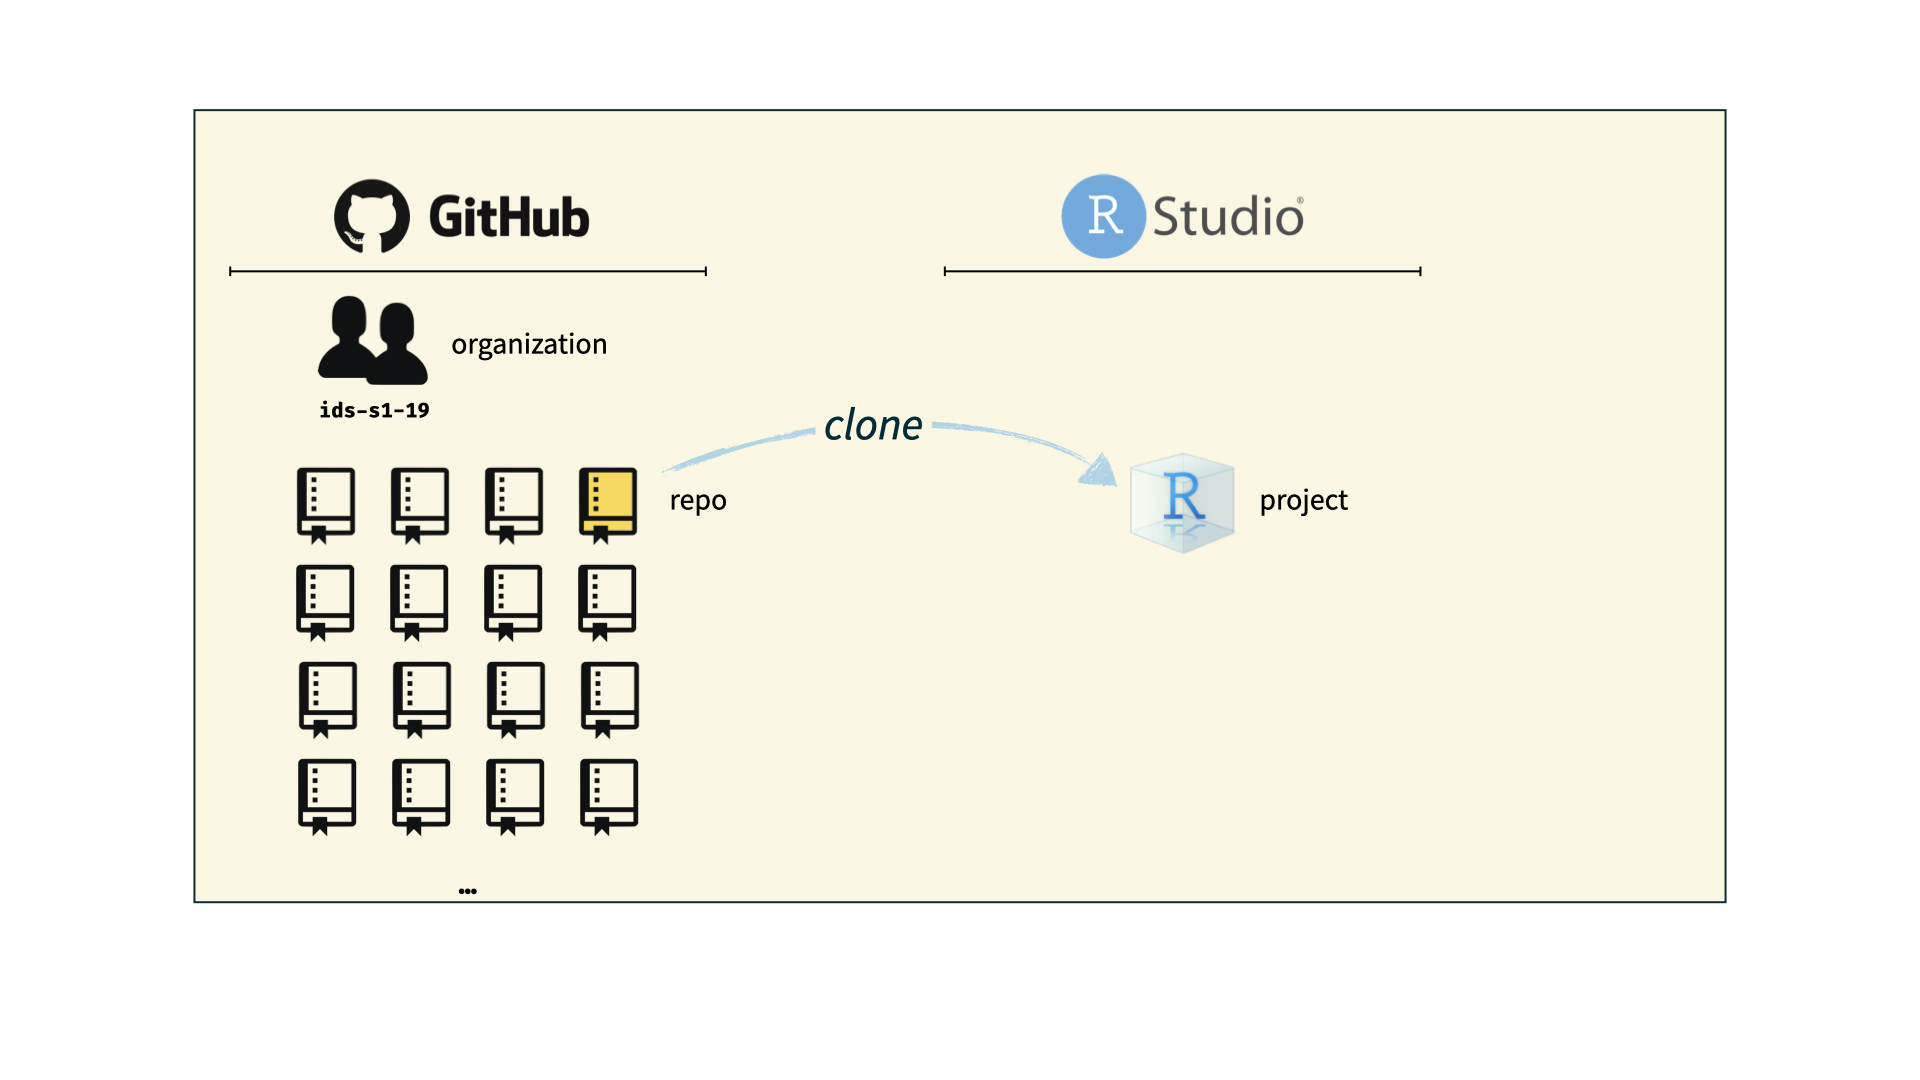
How does it work for Stat220?
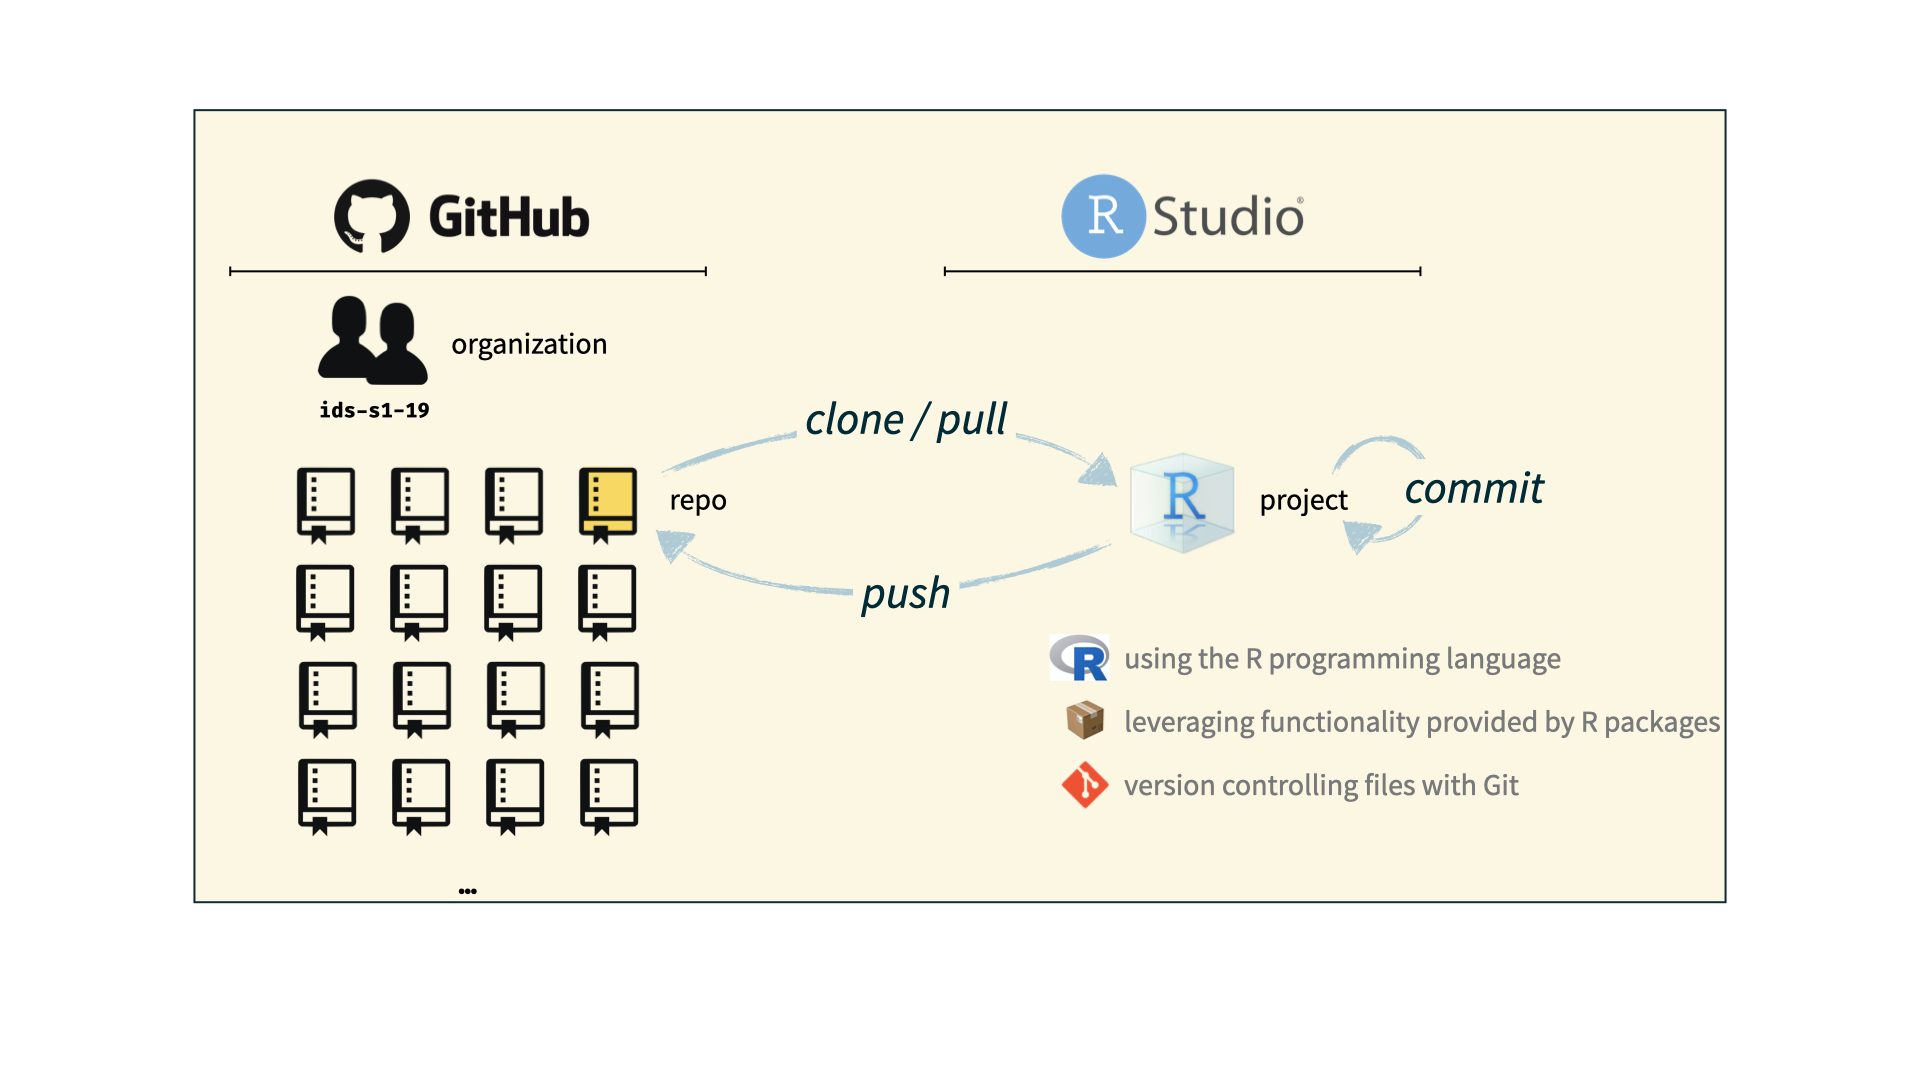
The toolkit

Scriptability \(\rightarrow\) R
Code environment \(\rightarrow\) RStudio
Literate programming (code, narrative, output in one place) \(\rightarrow\) R Markdown
Version control \(\rightarrow\) Git / GitHub
Hints
- To begin, use inline R code to replace “hard coding” the quantities that are highlighted below.
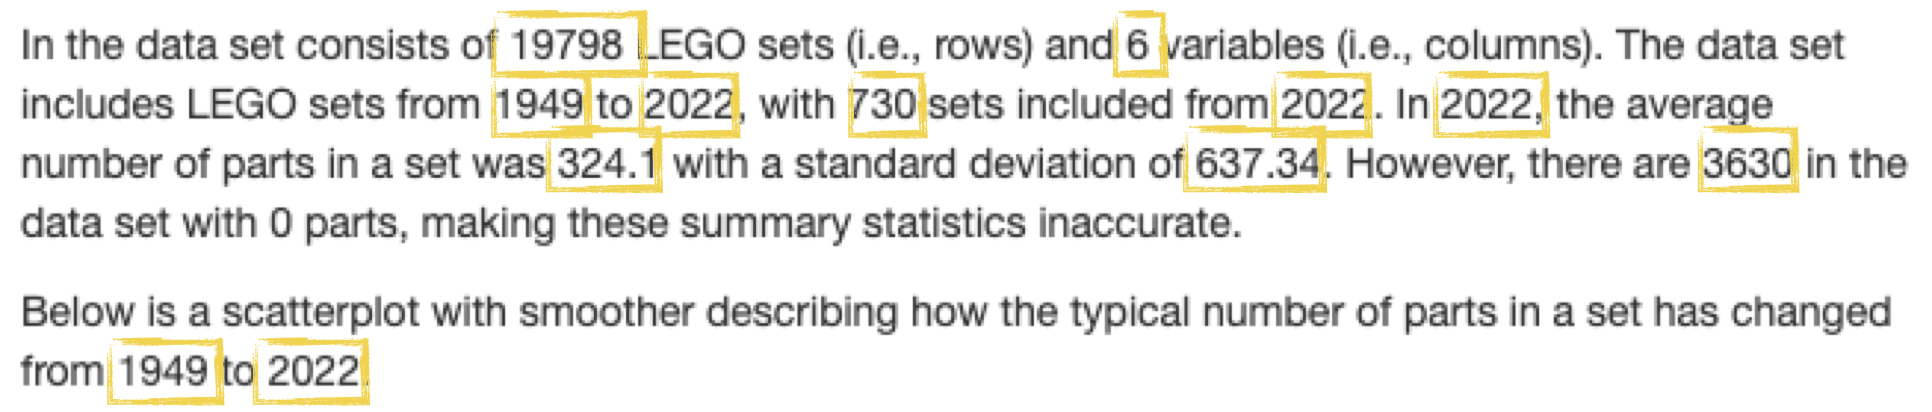
For example, instead of typing 19798 you would include nrow(sets) as an inline code chunk. Make sure the report knits and you get the right values.
Next, add a parameter to your YAML header that stores the location of the data set. Make sure the report knits.
Change the code chunk where you load the data set to use the
dataparameter you just defined rather than the hard-coded URL. Make sure the report knits.Now, let’s make a parameter for the source of the data set so you don’t have to search where every mention of it in the report, it will be with the other metadata (where it belongs). To do this, add a parameter that gives the source of your data (call it
data_source) and set it equal to “the 2022-09-09 repository on Tidy Tuesday.” Make sure the report knits.At this point it looks like everything is working—awesome job! To put it to the test, let’s update the parameters of your report and knit it to see if everything changes as we would expect. Here are the new parameter values:
- (optional) If you have time, or would like to try outside of class, I’ve created a practice gradescope assignment space. First, add .pdf output to your document and knit to PDF. Commit the PDF and push to github. Then, log into gradescope (you may have to go through the link on moodle the first time) and link your github repo to the submission space.