# A tibble: 549 × 16
   series episode baker     technical result uk_airdate     us_season us_airdate
    <dbl>   <dbl> <chr>     <chr>     <chr>  <chr>              <dbl> <date>
 1      1       1 Annetha   2nd       IN     17 August 2010        NA NA
 2      1       1 David     3rd       IN     17 August 2010        NA NA
 3      1       1 Edd       1st       IN     17 August 2010        NA NA
 4      1       1 Jasminder N/A       IN     17 August 2010        NA NA
 5      1       1 Jonathan  9th       IN     17 August 2010        NA NA
 6      1       1 Louise    N/A       IN     17 August 2010        NA NA
 7      1       1 Miranda   8th       IN     17 August 2010        NA NA
 8      1       1 Ruth      N/A       IN     17 August 2010        NA NA
 9      1       1 Lea       10th      OUT    17 August 2010        NA NA
10      1       1 Mark      N/A       OUT    17 August 2010        NA NA
# ℹ 539 more rows
# ℹ 8 more variables: showstopper_chocolate <chr>, showstopper_dessert <chr>,
#   showstopper_fruit <chr>, showstopper_nut <chr>, signature_chocolate <chr>,
# signature_dessert <chr>, signature_fruit <chr>, signature_nut <chr>Data Import &
Dates/Times
Day 11
Prof Amanda Luby
Carleton College
Stat 220 - Spring 2025
Today
- Importing data into R
- Working with dates and times
desserts data
Contains results from series 1-8 of The Great British Bake Off
Case defined by series, episode and baker
Basic syntax
All readr functions share a common syntax
readr functions
| function | reads |
|---|---|
| read_csv() | Comma separated values |
| read_csv2() | Semi-colon separated values |
| read_delim() | General delimited files |
| read_fwf() | Fixed width files |
| read_log() | Apache log files |
| read_table() | Space separated |
| read_tsv() | Tab delimited values |
desserts data
Contains results from series 1-8 of The Great British Bake Off
Case defined by series, episode and baker
# A tibble: 549 × 16
   series episode baker     technical result uk_airdate     us_season us_airdate
    <dbl>   <dbl> <chr>     <chr>     <chr>  <chr>              <dbl> <date>
 1      1       1 Annetha   2nd       IN     17 August 2010        NA NA
 2      1       1 David     3rd       IN     17 August 2010        NA NA
 3      1       1 Edd       1st       IN     17 August 2010        NA NA
 4      1       1 Jasminder N/A       IN     17 August 2010        NA NA
 5      1       1 Jonathan  9th       IN     17 August 2010        NA NA
 6      1       1 Louise    N/A       IN     17 August 2010        NA NA
 7      1       1 Miranda   8th       IN     17 August 2010        NA NA
 8      1       1 Ruth      N/A       IN     17 August 2010        NA NA
 9      1       1 Lea       10th      OUT    17 August 2010        NA NA
10      1       1 Mark      N/A       OUT    17 August 2010        NA NA
# ℹ 539 more rows
# ℹ 8 more variables: showstopper_chocolate <chr>, showstopper_dessert <chr>,
#   showstopper_fruit <chr>, showstopper_nut <chr>, signature_chocolate <chr>,
# signature_dessert <chr>, signature_fruit <chr>, signature_nut <chr>Warm up {.smaller}
Use
read_csv()to import thedessertsdata set from
https://stat220-s25.github.io/data/desserts.csvStore the data in the
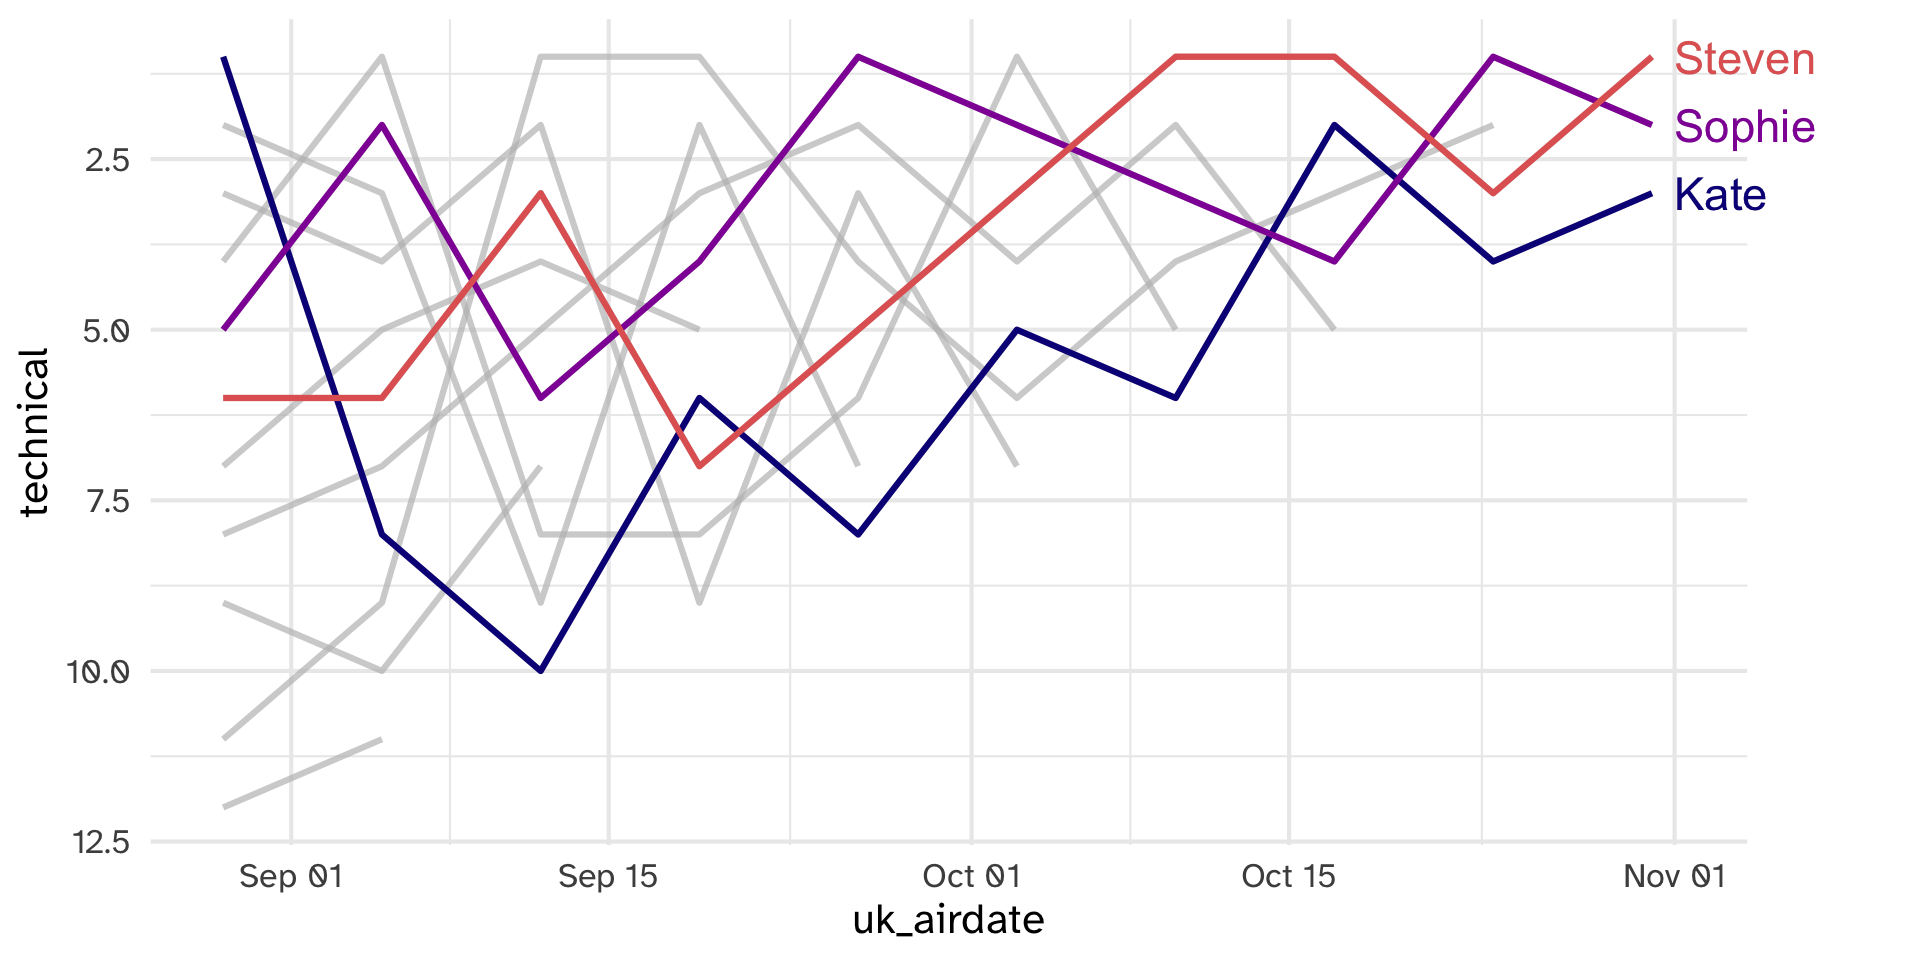
dessertsobjectOur goal is to make the following plot. Will this data allow us to do so?
06:00

Did it work as expected?
Rows: 549
Columns: 16
$ series                <dbl> 1, 1, 1, 1, 1, 1, 1, 1, 1, 1, 1, 1, 1, 1, 1, 1, …
$ episode               <dbl> 1, 1, 1, 1, 1, 1, 1, 1, 1, 1, 2, 2, 2, 2, 2, 2, …
$ baker                 <chr> "Annetha", "David", "Edd", "Jasminder", "Jonatha…
$ technical             <chr> "2nd", "3rd", "1st", "N/A", "9th", "N/A", "8th",…
$ result                <chr> "IN", "IN", "IN", "IN", "IN", "IN", "IN", "IN", …
$ uk_airdate            <chr> "17 August 2010", "17 August 2010", "17 August 2…
$ us_season             <dbl> NA, NA, NA, NA, NA, NA, NA, NA, NA, NA, NA, NA, …
$ us_airdate            <date> NA, NA, NA, NA, NA, NA, NA, NA, NA, NA, NA, NA,…
$ showstopper_chocolate <chr> "chocolate", "chocolate", "no chocolate", "no ch…
$ showstopper_dessert   <chr> "other", "other", "other", "other", "other", "ca…
$ showstopper_fruit     <chr> "no fruit", "no fruit", "no fruit", "no fruit", …
$ showstopper_nut       <chr> "no nut", "no nut", "no nut", "no nut", "almond"…
$ signature_chocolate   <chr> "no chocolate", "chocolate", "no chocolate", "no…
$ signature_dessert     <chr> "cake", "cake", "cake", "cake", "cake", "cake", …
$ signature_fruit       <chr> "no fruit", "fruit", "fruit", "fruit", "fruit", …
$ signature_nut         <chr> "no nut", "no nut", "no nut", "no nut", "no nut"…
A couple issues…
technicalis character, not numericuk_airdateis character, not date
The col_types argument
By default, read_csv looks at first 1000 rows to guess variable data types (guess_max), but we can also tell R how to read column types
Rows: 549
Columns: 16
$ series                <dbl> 1, 1, 1, 1, 1, 1, 1, 1, 1, 1, 1, 1, 1, 1, 1, 1, …
$ episode               <dbl> 1, 1, 1, 1, 1, 1, 1, 1, 1, 1, 2, 2, 2, 2, 2, 2, …
$ baker                 <chr> "Annetha", "David", "Edd", "Jasminder", "Jonatha…
$ technical             <dbl> 2, 3, 1, NA, 9, NA, 8, NA, 10, NA, 8, 6, 2, 1, 3…
$ result                <chr> "IN", "IN", "IN", "IN", "IN", "IN", "IN", "IN", …
$ uk_airdate            <date> NA, NA, NA, NA, NA, NA, NA, NA, NA, NA, NA, NA,…
$ us_season             <dbl> NA, NA, NA, NA, NA, NA, NA, NA, NA, NA, NA, NA, …
$ us_airdate            <date> NA, NA, NA, NA, NA, NA, NA, NA, NA, NA, NA, NA,…
$ showstopper_chocolate <chr> "chocolate", "chocolate", "no chocolate", "no ch…
$ showstopper_dessert   <chr> "other", "other", "other", "other", "other", "ca…
$ showstopper_fruit     <chr> "no fruit", "no fruit", "no fruit", "no fruit", …
$ showstopper_nut       <chr> "no nut", "no nut", "no nut", "no nut", "almond"…
$ signature_chocolate   <chr> "no chocolate", "chocolate", "no chocolate", "no…
$ signature_dessert     <chr> "cake", "cake", "cake", "cake", "cake", "cake", …
$ signature_fruit       <chr> "no fruit", "fruit", "fruit", "fruit", "fruit", …
$ signature_nut         <chr> "no nut", "no nut", "no nut", "no nut", "no nut"…
Looking for problems
List of potential problems parsing the file
# A tibble: 556 × 5
     row   col expected        actual         file
   <int> <int> <chr>           <chr>          <chr>
 1     2     6 date in ISO8601 17 August 2010 ""
 2     3     6 date in ISO8601 17 August 2010 ""
 3     4     6 date in ISO8601 17 August 2010 ""
 4     5     4 a number        N/A            ""
 5     5     6 date in ISO8601 17 August 2010 ""
 6     6     6 date in ISO8601 17 August 2010 ""
 7     7     4 a number        N/A            ""
 8     7     6 date in ISO8601 17 August 2010 ""
 9     8     6 date in ISO8601 17 August 2010 ""
10     9     4 a number        N/A            ""
# ℹ 546 more rows
Date formatting woes
# A tibble: 556 × 5
    row   col expected        actual         file
  <int> <int> <chr>           <chr>          <chr>
1     2     6 date in ISO8601 17 August 2010 ""
2     3     6 date in ISO8601 17 August 2010 ""
3     4     6 date in ISO8601 17 August 2010 ""
4     5     4 a number        N/A            ""
5     5     6 date in ISO8601 17 August 2010 ""
# ℹ 551 more rows
ISO8601 format: 2010-08-17
What we have: 17 August 2010

Adding format instructions
Year:
"%Y"(4 digits)."%y"(2 digits)Month:
"%m"(2 digits),"%b"(abbreviated name in current locale),"%B"(full name in current locale).Day:
"%d"(2 digits),"%e"(optional leading space)
Looking for problems
List of potential problems parsing the file
Addressing missing values
By default na = c("", "NA") are the recognized missing values
Looking for problems
List of potential problems parsing the file
# A tibble: 0 × 5
# ℹ 5 variables: row <int>, col <int>, expected <chr>, actual <chr>, file <chr># A tibble: 549 × 16
series episode baker technical result uk_airdate us_season us_airdate
<dbl> <dbl> <chr> <dbl> <chr> <date> <dbl> <date>
1 1 1 Annetha 2 IN 2010-08-17 NA NA
2 1 1 David 3 IN 2010-08-17 NA NA
3 1 1 Edd 1 IN 2010-08-17 NA NA
4 1 1 Jasminder NA IN 2010-08-17 NA NA
5 1 1 Jonathan 9 IN 2010-08-17 NA NA
6 1 1 Louise NA IN 2010-08-17 NA NA
7 1 1 Miranda 8 IN 2010-08-17 NA NA
8 1 1 Ruth NA IN 2010-08-17 NA NA
9 1 1 Lea 10 OUT 2010-08-17 NA NA
10 1 1 Mark NA OUT 2010-08-17 NA NA
# ℹ 539 more rows
# ℹ 8 more variables: showstopper_chocolate <chr>, showstopper_dessert <chr>,
# showstopper_fruit <chr>, showstopper_nut <chr>, signature_chocolate <chr>,
# signature_dessert <chr>, signature_fruit <chr>, signature_nut <chr>Column casting functions
| Type | dplyr::glimpse() |
readr::col_*() |
|---|---|---|
| logical | <lgl> |
col_logical |
| numeric | <int> or <dbl> |
col_number |
| character | <chr> |
col_character |
| factor | <fct> |
col_factor |
| date | <date> |
col_date |
?read_csv
Your turn
Use the appropriate read_<type>() function to import the following data sets:
data-4.csvtricky-1.csv
The full URLs are in the 11-import.Rmd activity. (It might be helpful to look at the data file before trying to import it into R)
If you hit any errors/problems, be sure to explore them and identify the issue, even if you can’t “fix” it.
read_excel
Get data out of excel and into R
Support for both
.xlsand.xlsxfilesPart of the
tidyverseNeed to load separately
![]()
read_excel works like read_csv
sales data
Are these data tidy? Why or why not?
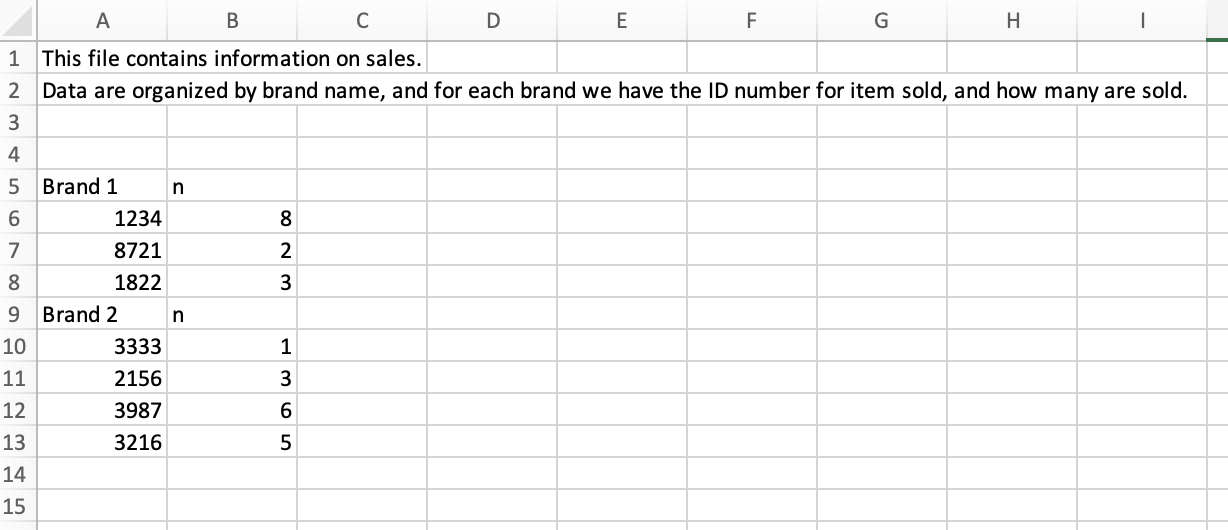
Sales data
What “data moves” do we need to go from the original, non-tidy data, to this tidy one?
# A tibble: 7 × 3
  brand   id    n
  <chr>   <chr> <chr>
1 Brand 1 1234  8
2 Brand 1 8721  2
3 Brand 1 1822  3
4 Brand 2 3333  1
5 Brand 2 2156  3
6 Brand 2 3987  6
7 Brand 2 3216  5
Try it
Read in the excel file called sales.xlsx. You’ll first need to download it to your computer by visiting the URL, and then save it in the same folder as the .Rmd file you are working in
Step 1: read in the data so it looks like the following:
# A tibble: 9 × 2
  id      n
  <chr>   <chr>
1 Brand 1 n
2 1234    8
3 8721    2
4 1822    3
5 Brand 2 n
6 3333    1
7 2156    3
8 3987    6
9 3216    5
Stretch goal: Manipulate the data so it looks like the following:
# A tibble: 7 × 3
  brand   id    n
  <chr>   <chr> <chr>
1 Brand 1 1234  8
2 Brand 1 8721  2
3 Brand 1 1822  3
4 Brand 2 3333  1
5 Brand 2 2156  3
6 Brand 2 3987  6
7 Brand 2 3216 5 05:00
What if I already imported data and have dates/times as character strings or numeric vectors?
Ultramarathon results
- Ultra marathon = anything longer than 26.2 miles
- The dates and times imported as character strings!
## Rows: 392
## Columns: 11
## $ state            <chr> "Minnesota", "Minnesota", "Minnesota", "Minnesota", "…
## $ Event            <chr> "Zumbro", "Zumbro", "Zumbro", "Zumbro", "Zumbro", "Zu…
## $ City             <chr> "Theilman", "Theilman", "Theilman", "Theilman", "Thei…
## $ race_url         <chr> "https://calendar.ultrarunning.com/event/zumbro", "ht…
## $ date             <chr> "04/08/21", "04/11/20", "04/13/19", "04/13/18", "04/0…
## $ Finishers        <chr> "121", "Race Cancelled", "Race Cancelled", "49", "149…
## $ top_result_m     <chr> "5:23:55", "Race Cancelled", "Race Cancelled", "9:13:…
## $ top_result_f     <chr> "6:30:42", "Race Cancelled", "Race Cancelled", "10:15…
## $ distance         <chr> "34 Miles", "50 Miles", "50 Miles", "50 Miles", "50 M…
## $ elevation_rating <dbl> 3, 3, 3, 3, 3, 3, 3, 3, 3, 3, 3, 3, 3, 3, 3, 3, 3, 3,…
## $ surface_rating   <dbl> 3, 3, 3, 3, 3, 3, 3, 3, 3, 3, 3, 3, 3, 3, 3, 3, 3, 3,…
Functions for working with dates and time spans
Part of the
tidyverseNeed to load separately
![]()
Parsing dates
{lubridate} functions are intuitively named
Ultramarathon example
Dates are in the form 04/08/21, so use mdy() to parse
Rows: 392
Columns: 11
$ state            <chr> "Minnesota", "Minnesota", "Minnesota", "Minnesota", "…
$ Event            <chr> "Zumbro", "Zumbro", "Zumbro", "Zumbro", "Zumbro", "Zu…
$ City             <chr> "Theilman", "Theilman", "Theilman", "Theilman", "Thei…
$ race_url         <chr> "https://calendar.ultrarunning.com/event/zumbro", "ht…
$ date             <date> 2021-04-08, 2020-04-11, 2019-04-13, 2018-04-13, 2017…
$ Finishers        <chr> "121", "Race Cancelled", "Race Cancelled", "49", "149…
$ top_result_m     <chr> "5:23:55", "Race Cancelled", "Race Cancelled", "9:13:…
$ top_result_f     <chr> "6:30:42", "Race Cancelled", "Race Cancelled", "10:15…
$ distance         <chr> "34 Miles", "50 Miles", "50 Miles", "50 Miles", "50 M…
$ elevation_rating <dbl> 3, 3, 3, 3, 3, 3, 3, 3, 3, 3, 3, 3, 3, 3, 3, 3, 3, 3,…
$ surface_rating   <dbl> 3, 3, 3, 3, 3, 3, 3, 3, 3, 3, 3, 3, 3, 3, 3, 3, 3, 3,…
Extract info from a date/time
{lubridate} functions are intuitively named
| function | action |
|---|---|
year(), month() |
extract year/month |
week() |
extract week of the year |
day(), wday() |
extract day of month/day of week |
hour(), minute(), second() |
extract hour/minute/second |
Adding label = TRUE creates an ordered factor (for month or wday)
Extract info from a date/time
The most recent race in the data set was on 2022-01-31
What month was that in?
Measuring time
How long ago was the last race?
Differences in date/time objects are
difftimeobjectsdifftimes use inconsistent units (sometimes weeks, days, hours, minutes, or seconds)
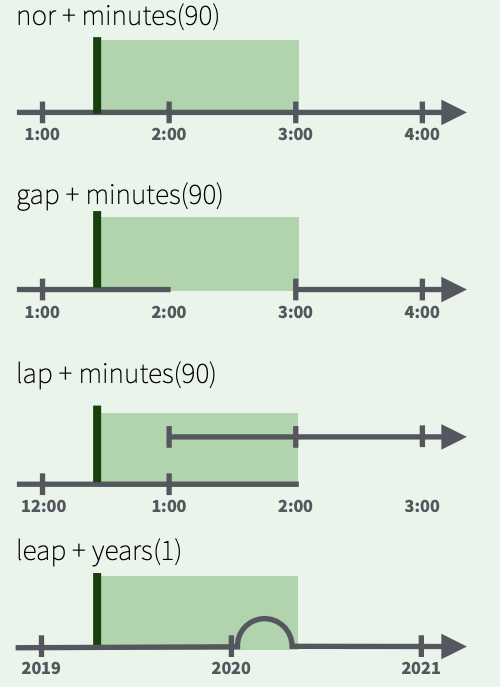
Math with date-times
Math with date-times relies on the timeline, which behaves inconsistently:
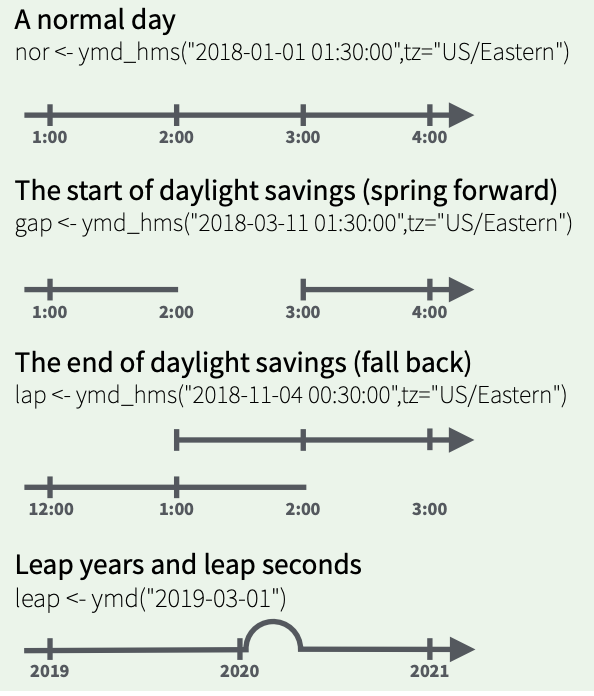
Measuring time: durations
Track the passage of physical time; always measured in seconds
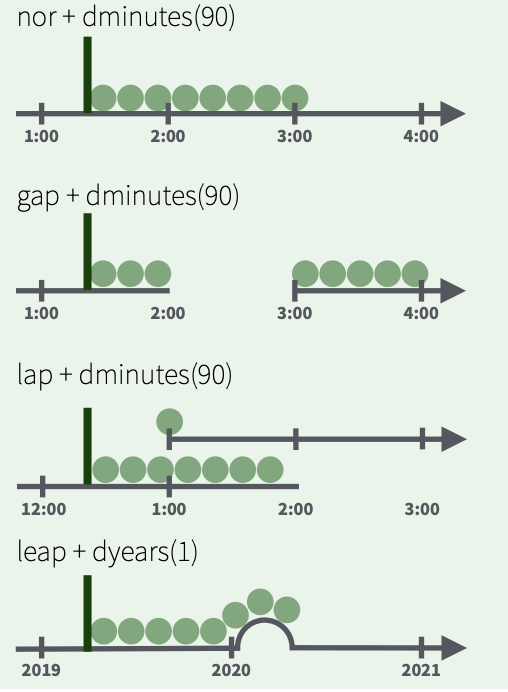
Measuring time: periods
periods track changes in clock times, ignoring timeline irregularities
Try it
Create a new copy of the desserts dataset, but do not parse the uk_airdate within read_csv. Instead, leave it as a character vector and parse the date using {lubridate} functions. Which approach do you prefer?
Then, create a new column called how_long_ago that measures the time between today and the UK airdate of the episode. Can you format this column:
- in years
- in months
- in weeks
- in days
Hint: see time_length
05:00
If time
Get as far as you can in replicating this plot of series 8 data: