03:00
Reactivity
Day 24
Very basic app
# app.R
library(shiny)

ui <- fluidPage(
  headerPanel("basic app"),

  sidebarPanel(

    sliderInput("a",
      label = "Select an input to display",
      min = 0, max = 100, value = 50)
  ),

  mainPanel(h1(textOutput("text")))
)

server <- function(input, output) {
    output$text <- renderText({
      print(input$a)
    })
}

shinyApp(ui = ui, server = server)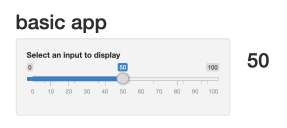
Very basic app
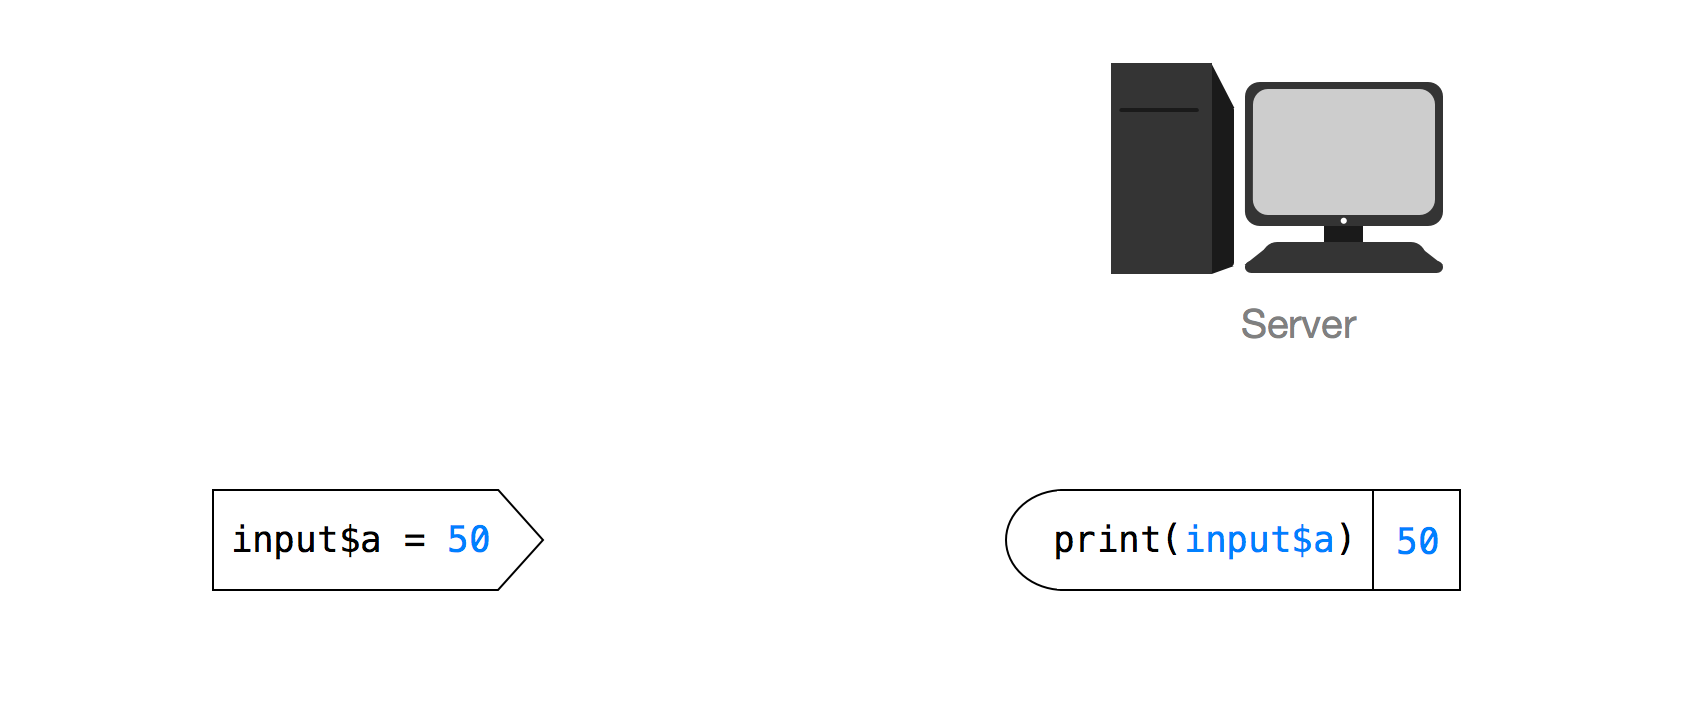
How does print(input$a) know when to change?
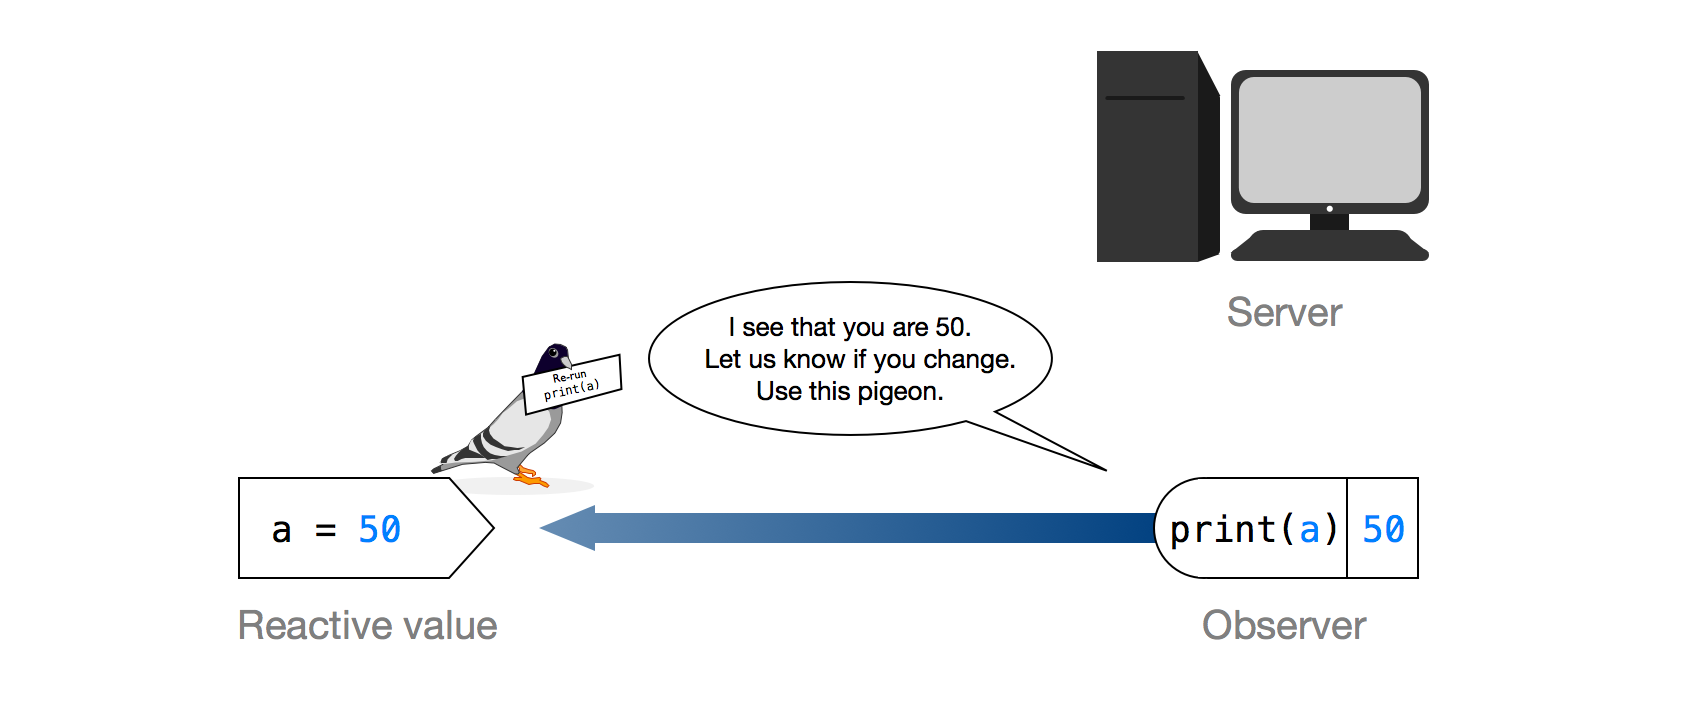
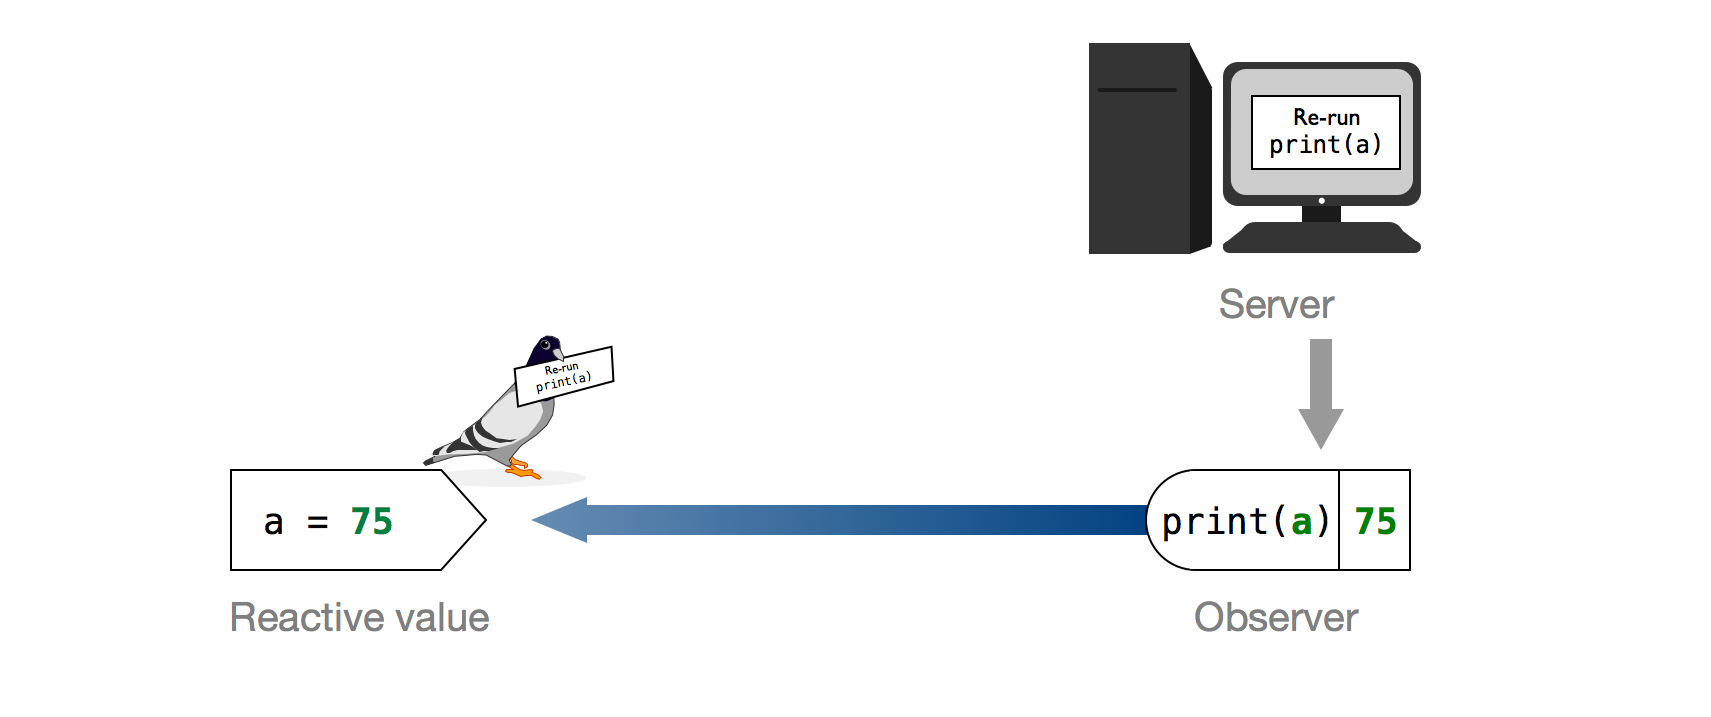
Reactivity via carrier pigeon
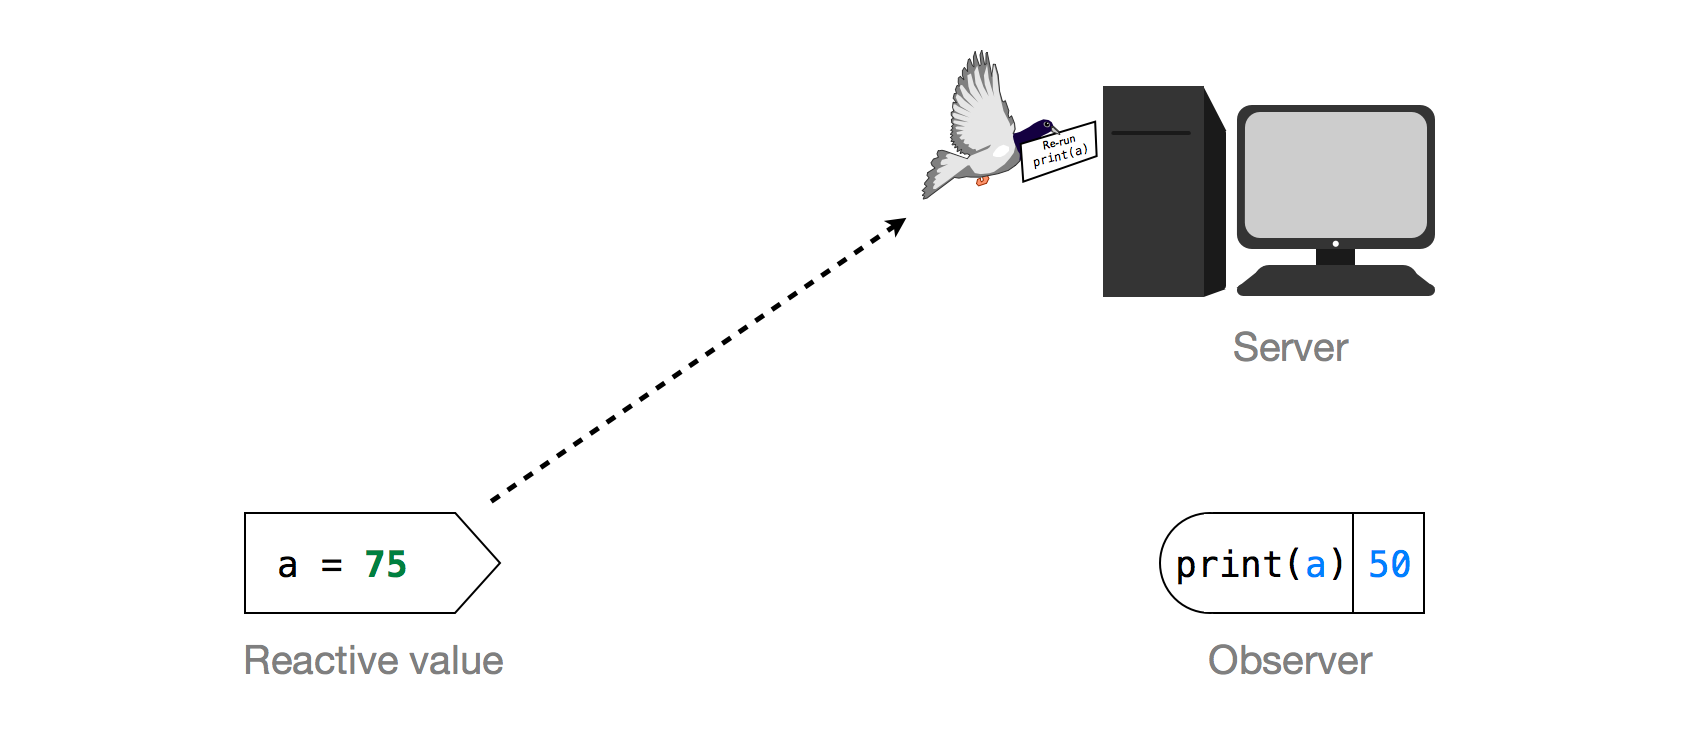
Reactivity via carrier pigeon
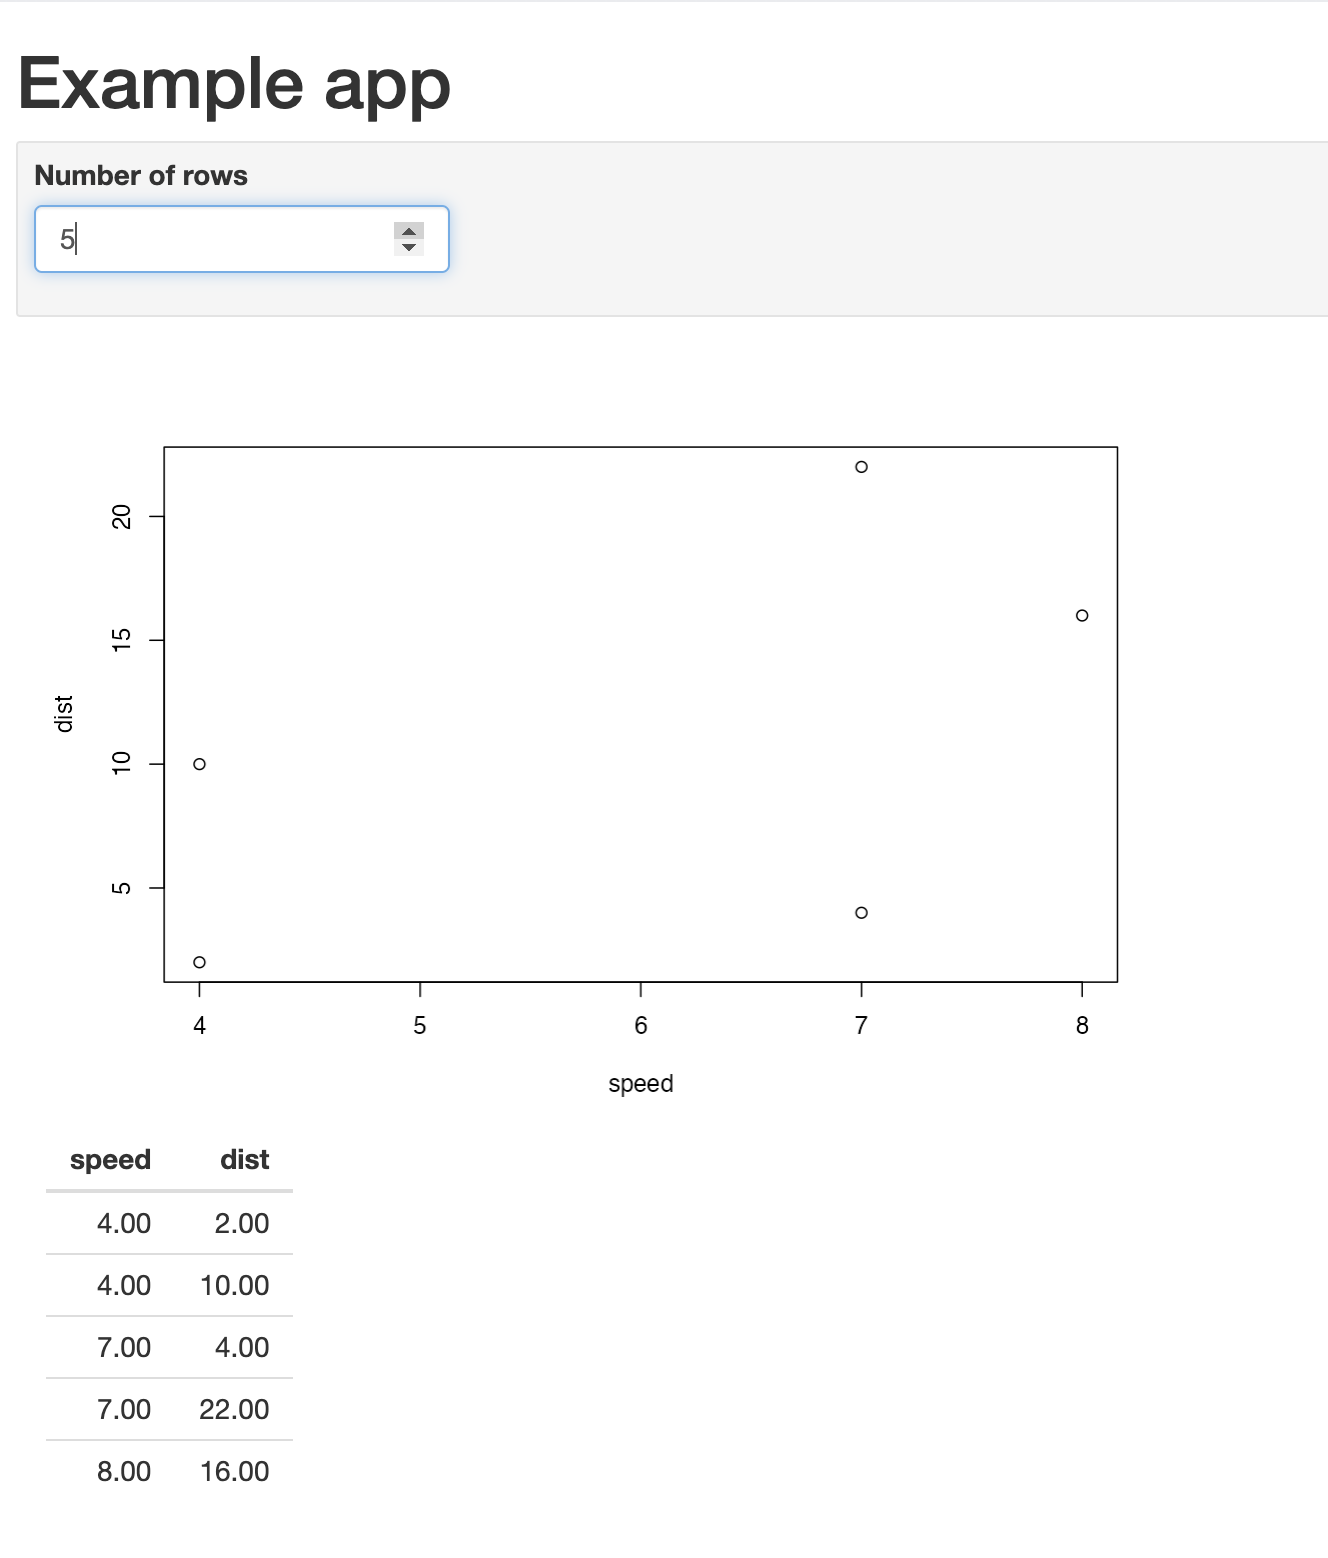
Example